Data sources
The data model builds properties and metrics from sources. There are two kinds, and a project can use both:
- Event sources: your raw event tables, one row per event. This is what event setup configures, and where DAU, retention, revenue, and every user-level metric come from.
- Pre-aggregated sources: data that arrives already summarized to date by dimension, most often user-acquisition spend and installs from an ad network, MMP, or finance export. There are no per-user rows to model; the grain is a date crossed with a few dimensions (campaign, country, platform).
Both appear on the Data Model page. Event sources are listed under “EVENTS · SOURCES”; summarized feeds under “PRE-AGGREGATED SOURCES”.
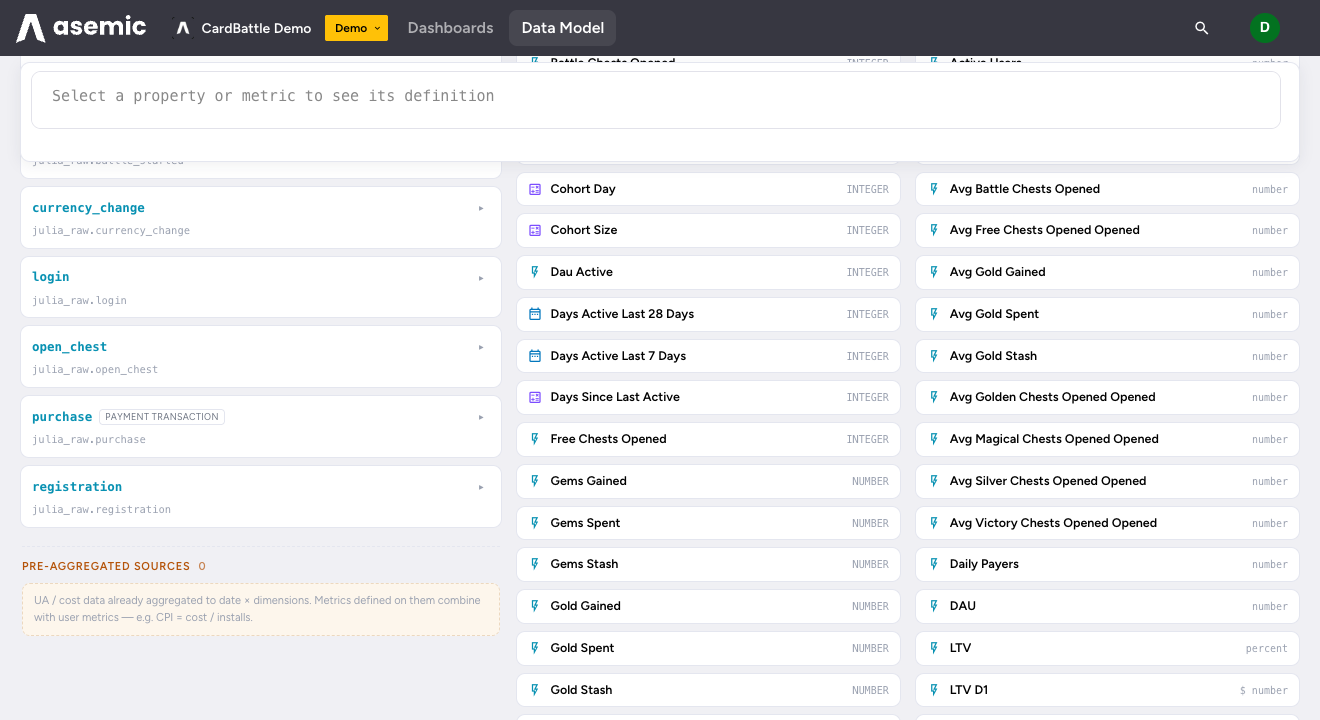
Why pre-aggregated sources exist
Cost data is fundamentally different from event data. An ad network does not hand you one row per impression; it hands you a daily table of spend and installs, already grouped by campaign and country. Forcing that into the event model would be wrong, so Asemic models it as what it is: a pre-aggregated source at date × dimension grain.
The payoff is that a metric defined on a cost source and a metric defined on your user data can be combined in one formula, even though they come from different places. That is how the acquisition numbers every F2P team lives on get defined once, in the same governed layer as the rest:
metric.CPI  = metric.Cost / metric.Installs      unit "$" prefix
metric.ROAS = metric.Revenue / metric.Cost       as percent
metric.Cost reads from the pre-aggregated UA source; metric.Installs and metric.Revenue read from your user data. The engine joins them on the shared axis (date, and any dimension both sides carry) and applies the same null-safe division as everywhere else. See Writing formulas for how a formula references a source.
The shared-dimension rule
A metric that spans two sources can only be broken down by a dimension that both sources carry. country and platform usually exist on both the UA feed and your user data, so CPI by country works. But a dimension that lives only on one side, say a spender_tier you derived from purchases, does not exist on the cost source. Grouping a cross-source metric by it returns an empty series rather than a wrong number.
This is a property of the data, not a limitation to work around: cost was never recorded per spender tier, so no tool can attribute it there. Asemic makes the boundary explicit instead of silently inventing a split.
Axis
Metrics that reference a pre-aggregated source plot over calendar dates. Cohort-day analysis (days since install) needs per-user registration timing, which a summarized feed does not carry, so cross-source metrics like CPI and ROAS are daily by construction.
Permissions
Access is scoped per source. A member who should see product metrics but not spend can be granted the event sources without the cost source, and any metric that reads from a source they cannot see is hidden from them, in the app and in AI chat alike. Authoring sources and the metrics on them requires the Data modeler role (see Roles and permissions).
Next: Writing formulas covers the reference syntax that ties sources, properties, and metrics together.