Warehouse-native analytics cost, and how to keep it low
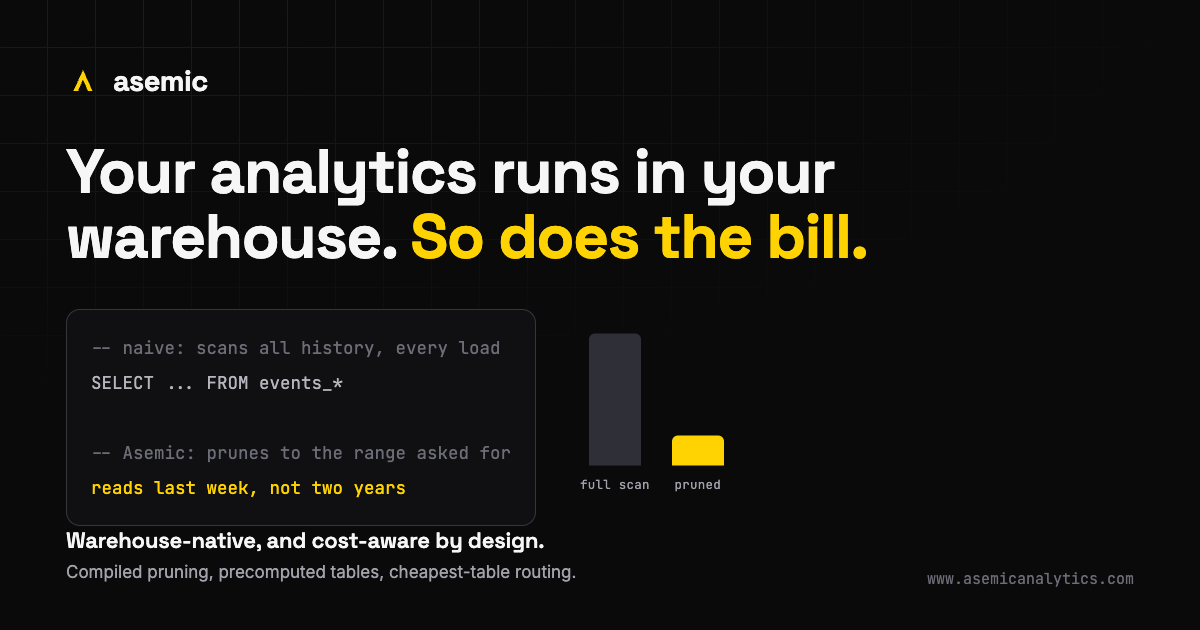
Warehouse-native analytics has a clear appeal for a game studio: your raw events stay in BigQuery or Snowflake, there is no per-event vendor bill, and the numbers are computed against the tables you already trust. It is the right posture, and it is why studios increasingly expect it. But it moves a cost you should understand before you commit to it. Every chart is a query that runs in your warehouse, on your bill. Done carelessly, that bill grows with every year of history and every open dashboard. Done well, it stays small and predictable. The difference is entirely in how the tool on top is built.
This is a look at where warehouse-native analytics cost actually comes from, and the specific engineering choices that keep it down. It is written for the person who will get asked about the BigQuery line item.
Where warehouse-native analytics cost actually comes from
On BigQuery’s on-demand pricing you pay for bytes scanned; on capacity pricing (Editions) the same reads surface as slot-time and concurrency pressure. Snowflake bills for warehouse time, so reading less data means less time, though the mapping there is looser. Across all of them, the cost of a query tracks, to a first approximation, how much data it has to move. There are two common ways a naive setup makes that enormous.
The first is re-scanning raw history on every load. If a chart runs against a view over a large events table, and that view is not pruned, it reads the whole table every time someone opens the dashboard. This is not hypothetical: BigQuery only skips the irrelevant daily shards of a Firebase or GA4 export when the query filters on the shard suffix itself. A plain view over events_* silently loses that, so a chart over last week scans two years of history. Multiply by every chart, every viewer, every refresh, and the export that was “free” becomes a recurring bill. BigQuery will serve an identical query from a free 24-hour result cache, but that rescue is thinner than it sounds: a live export keeps invalidating it, and a dashboard on a rolling date window changes the query text on every load, so the cache tends to miss exactly when a busy studio needs it.
The second is re-deriving everything from raw events on every query. Retention, lifetime value, days since registration, spend to date: if these are computed from scratch on each chart load, every view re-runs the same heavy joins and window functions over the raw data. You pay full price for work you already did a minute ago.
How Asemic keeps the bill down
The design treats your compute bill as a constraint, not an afterthought. Four choices do most of the work.
Compiled pruning. Every query is compiled with its date filter pushed down to the partition or shard, so a chart over last week reads last week, not the whole history. The shard pruning that a hand-written view over events_* loses is compiled in for you (there is more on this in Firebase / GA4 export). This one choice is the difference between a bill that scales with the range you look at and one that scales with the age of your game.
Read a precomputed table, not raw events. Charts read a precomputed entity table: one row per user per day, holding that user’s properties as of that day, computed once and queried many times. The heavy joins and window functions run during materialization, not on every dashboard load. This is a tradeoff, not a free lunch: the table costs storage and compute to build. The saving comes from building it incrementally, one day at a time, so you pay to derive each day once instead of on every chart load.
A clustered layout, and no pre-joining. Columnar warehouses read only the columns a query references, and when the rows are clustered by what you filter on, only the blocks that match. The engine leans on both: it reads the columns a metric actually needs, and it keeps the hot tables clustered so a filtered read prunes to a fraction of the blocks. It also avoids folding everything into one wide, pre-joined table. A pre-join fans rows out and works against clustering, so every read wades through more data than the question required. Joining at query time instead keeps the table that most charts hit dense and cheap to scan.
Route to the cheapest table that can answer. The engine keeps a small set of derived tables at different grains and sends each query to the smallest one that can answer it, instead of always hitting the largest. A question that a compact daily table can answer never touches the full lifetime history.
None of this is visible to the person reading the chart. It shows up only as a warehouse bill that stays flat as your history grows and your dashboards multiply.
Why this matters more for games
A live game is close to the worst case for naive warehouse querying. You accumulate years of events, millions of players, and dashboards that live-ops and production reload throughout the day. Scan cost compounds with history and with viewers at the same time. A tool that re-scans raw events on every load turns “warehouse-native” from a cost advantage into a cost liability precisely as your game gets more successful and your history gets longer.
Warehouse-native is only actually cheaper if the analytics on top is built to respect the bill. That is an engineering stance, not a checkbox.
The part you can audit
There is a second benefit to the compute being yours: you can see exactly what runs. The queries execute in your project, against your tables, and the cost lands in your own billing rather than an opaque vendor line item. If you want to know what a chart costs, you can look. That transparency is the same property that makes a governed semantic layer trustworthy in the first place: the work is legible and it runs in your infrastructure, with nothing hidden in a black box you are asked to trust on faith.
This is the unglamorous foundation under the interesting part. The reason to keep queries cheap and correct is so the studio can afford to ask harder questions of the data, like why a retention number moved rather than only that it did. If you want to see it running on your own warehouse, book a demo: 45 minutes, no sales loop, and we will point it at your data and watch the query cost with you.